

There is a great saying
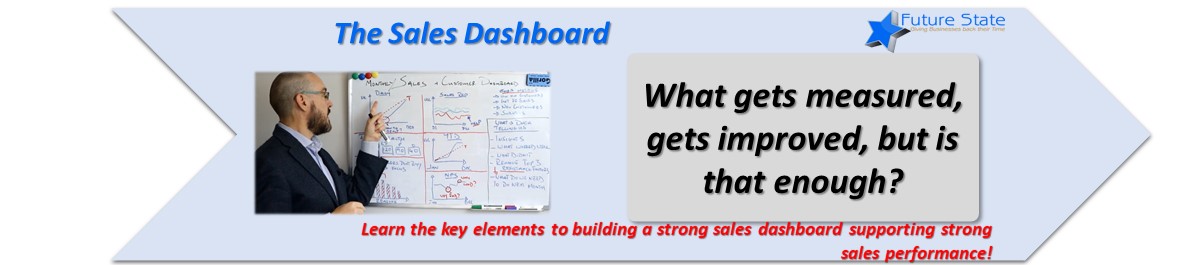
‘What gets measured gets improved’
But is that enough…? What happens if you are measuring the wrong things? You guessed it, you’ll improve the wrong things..
See metrics drive behaviours so it crucial in your business to drive the right behaviours to deliver the right results..
And with metrics, they need to be constantly adding value, otherwise there is no point.. Metrics should directly relate to the continuous improvement on your targets or current position.
They also need to feed into a dashboard, so the manager of a business / business area can very quickly get an update in realtime of where everything stand and what is going well and what needs help now. But what should a dashboard consist of…?
Well lets go back a step…
Before we start building dashboards we need to understand what we are trying to achieve. In this video you will see I’ve taken a sales dashboard as an example.
There are basically 2 types of metrics
- Real time metrics that give you real time information
These are the foundations of a strong dashboard and more importantly strong performance. Too many times I see teams just focusing on the monthly and during that monthly meeting they are discussing a sub standard month.. There is no value to this as it’s after the fact. Real time metrics can show you if you are heading off course so you can act swiftly to bring it back in. Will you always be successful? No, but you learnt ways that didn’t work, so there is always value with this. These metrics are then the foundations of the Periodic metrics.
2. Periodic metrics that can be broken down in to a few categories
-
- Set frequencies – Monthly / Quarterly etc
- Trends – e.g. YTD year to date
They all have there place and they should have set targets. Why? So you can assess that what you are doing is achieving the right results and if not, then you can take action on the ground to tweak the activities to effect the outcome. This is not a once size fits all approach and they require continued review and assessment as the goal should be to
- Ensure you are delivering on your expectations
- And when you are, how can you exceed them
That is continually improving on your current position as this is most strategic and safest thing to do for your business. Improving your business and team performance all starts with knowing what dials to turn!
The Sales Dashboard – Video Transcripts
Hi, Shay Lynch here, director of Future State. And today’s topic is all about monthly dashboards. And I’m gonna use the sales and customer as an example. But this, the whole method and process behind this would be the same for any department, right? So we talked about other dashboards in the past like the leader dashboard at the highest level in the business. You know their balance score card or their dashboard that they wanna, see real time and monthly data, right? Then we go down a level, you know, what does each area of your business need to see on a monthly day basis? To ensure that they’re doing everything they can to improve on their targets and their performance. So I use sales and customers as an example because this is probably the one I get to develop most often. So when I’m asked to develop most often with my customers right? So few things before I go into what’s on it, just a few views you want to see, right? While it’s a monthly dashboard you want to be able to build this dashboard over the course of a month. So you can use whatever tool you like. If you’re a small business, Excel is amazing for this, but you want to be able to see things in real time that then accumulate over the month to show you the monthly view. And then even with that over the year to day view, so you can see trends, okay? So with that first things I want to talk about it, right? The daily part of this dashboard, this is gonna be tracked daily, right? And we’ve talked about this before. The importance of tracking something daily is so you can react in real time. You don’t wait till the end of the month to see something wrong. ‘Cause it’s too late. It’s after the fact, it’s useless information. We want information to serve us as best it can. So this daily charge here, and I used to like, I like to use charts because they’re more visual. You can use whatever visual you want, whether it’s tabular, whether it’s this type of chart or other types of chart. Some are suited for lines, PI or bar. It all depends on your preference and what your people like. Okay. But daily I like to do as a line chart, because you can have very easily. Now, this again, just very simple for illustration purposes, your target’s along that red line. So you’re tracking your volume against your days. Day one to 20 of the month, right? So you can see the first start of the month, you’re behind targets. This should be a trigger for your team to react and work together. Not just a sales rep on their own, for the team to work together to figure out what’s going wrong? How do we react? How do we get back on track? So the month turns out as we anticipated. This is extremely important. This will really support your monthly performance and your year performance. And again as I said, this is the importance of tracking daily. This is how, and then again, to talk about the cascading metrics from up down, bottom to the top, this is what your directors will see that when they look at their dashboards, they will see, sales, okay, they did well. You know, or if they didn’t do well they can go further to detail and they can support you. So this is all about, hey this information supports all performance going right to the top, okay? So this is the first one which I believe is extremely important, right? You need to understand what your targets are. If you don’t have any, I suggest you start developing like stretch targets, as we say. Something that you know you can achieve plus a little bit more. Don’t create a sense of emergency within your team. Create a sense of urgency, right? Stretch targets that will meet your baseline requirements, support the business and some develop it, okay? Daily, right? Then I’m gonna come back to funnel health in a minute. But then you could also have a daily sales rep performance, right? And again, this is a simplified view. It may not be daily. It depends on your industry or your sector in terms of your frequency of sales. But the same methods and theory and concepts apply, right? Their volume again stays again, right? You have three reps here but it knows it by the three different color of lines. Right? And you can see, two of them are performing reasonably well and one is struggling. This is a cry for help, right? This is not about beating the stick over the person who wasn’t performing well. This is about going to the salesperson and ask them, “What is wrong? Can we help you? Was it just a blip? Was it just something that your customers were slow this month? Or is there something that we need to discuss?” Okay? So it’s all about help. It’s not about cracking the whip. And what I mean by help is not just the manager but the other sales rep supporting each other to ensure they’re all helping each other to get the same results. And a great example of that is, one of previous clients of mine. When one sales rep discovered, what was the messages the customers preferred to hear most that led to buying decisions, they shared those messages with the other reps. They all benefit. It wasn’t about holding on so you could be the best. It’s not a game between your salespeople. It’s not that because then it becomes greedy. It’s about helping each other for the good of the business. Okay? So again, that’s another sort of daily effort. Like it doesn’t have to be daily, it can be monthly too. Right? So then I wanna come back to your funnel health. This is your daily up here right? Now we’re gonna look at sort of trends and insights, right? Funnel health on a monthly basis, right? So I’ve broken the funnel then just to four very high level steps. So lead generation, LG, LL, lead floating, so you can define between hot and cold days. Then proposals and then orders. Like it depends again on what way you wanna break it down to the micro level, right? So again this can give us like a view of like how we’re performing and our conversions at every step. So you can do a conversion between lead generation to hot leads. Then you can do one to proposals. And then the big one is lead generation to orders, which is your sales conversions, right? So again, you could do a trend on year to day of these four levels to see how is it performing month on month. But it’s just important to know that you’re still generating leads here that will deliver a certain quantity of sales. ‘Cause then you can start, once you can start seeing the trends on this, then you can predict what is gonna happen next within a level of accuracy, right? So there we go, right? Funnel health. Now this is one of my favorites, which nobody does, right? But it’s a super power when it comes to activities. And I’ll go through that in a minute. But, what I like to track and I use what’s called the pre-jolt. You know, what are the, 20% of issues that are causing you 80% of your non buying decisions, right? What does that mean? Well, when you’re talking with your customers, if you had every sales rep, ask your potential customers, a number of key questions come in, and like before they leave that meeting. And then they gather that into whatever database you have whether it’s Excel or something else, you know. Over the course of the month, if every rep did that for every meeting of every day, of every week, of every month, you’re gonna have amazing data of why customers didn’t buy from you. So with this, then you can pretell your top three. What were the top three biggest reasons this month? Guess what you do the next month. How can you mitigate them as best you can? Amazon are amazing at this process, right? So that’s why customers didn’t buy. So then we come to year today. You know, and this is like looking at trends in your marketplace and how your business’s performance. Maybe you’re looking at it against your strategy. If you’ve taken new steps is it working or is it not working? This is where the trends can tell you what is happening in your market place, right. And then when it comes down to the customers, right? You can talk about your MPS, your net promoter score. And this is all about would your customers recommend you to their colleagues or friends or whatever, you know, and they rate it on a score. And it depends, you can use one to 10 or whatever. One to a hundred or one to five, right? But again, of course, like trends you can see what it was about their quality. Was it good there? So you can go a little bit deeper in your MPS and go, like, if you’re asking your customers you know, especially if you’re in the hospitality or retail business, every cashier could ask, right? Or every person reception, can ask, what did you like about your stay or the service? What you didn’t like? Gather that data. You’ve got amazing monthly data again, that you can absolutely act on. Very simple and it can be very natural in the course of conversation, right? Very simple but yet again can be very, very powerful. So these are the sort of main ones that I will always try to build for a customer in terms of sales, right? You can extend this backwards into marketing as well because as I’m always saying lead generation is technically a marketing activity but yet it’s the first stage of the sales funnel. So I believe it’s within here. So you can do some marketing views in this as well. But other metrics you may wanna capture. And again, it all depends on what you’re trying to achieve and what’s unique and what’s tailored to your business that will help. What are the key drivers in your marketplace, your business, your customers and your teams that will help you sell better, right? So other metrics that you can work with, right? So we talk about win-win customers. Customers that add value to your business, and you add value to theirs. The win-win. You could do a view of a, what are the customers that are not adding value and what are the customers are? What’s the cohort? What do we need to do with the customers who are not adding value? Can we bring them along the journey so they do? Or do we have to fire them? So that’s one example. We could also do a cost of sales model. The cost of sales is huge in any business. And I work in processes where 95% of the sales process didn’t lead to a sale. And of that 95% that did, only 3% led to a valuable sale. So you can do cost of sales views as well. And that could be something that could only be required for a short term to get something back on track that you don’t need to track all the time. ‘Cause there’s no point in tracking stuff is not adding value, it’s a waste of time. And as you know, I’m not a big fan of waste, right? You could also talk about a percent of new customers against like returning customers depending what your model. If you’re looking for market domination, you could actually have a strategy that requires new customers. You could also have a strategy that just focuses on generating new business with existing customers, depending on what your model is. So that could be another view. You could also we’ll have surveys, you know. Again, if you’re smart about what you’re doing along here and you’re asking key questions you know, you’re getting a lot of customer information but there’s no issues with wanting to ask them directly through surveys. So you could do periodic surveys to see what else they would like, what they don’t like, what ideas would they have to improve your service. So there’s multiple views you can do. Some that would remain constant all the time. Some you can bring in for a period just to check a few things, right? So this is all the data side, okay? This is what the data is. It’s still no use just getting this data if you’re doing nothing with it, right? So then we have to talk about what is the data telling us? Right? First thing I always like to look at the insights and commentary? What do you want to come? What is this information telling you in a few key bullet points? What is it telling you? It’s telling you here, for example yes, we’re performing against our targets. Actually we turned a corner. Our strategy started to work here and it’s working. We keep doing what we’re doing, right? It’s telling us that our MPS score is good and it’s not so good there. So what does that tell you this? And again, there’s a few other pieces here that you can say, what do you need to focus on? And then you talk about what worked well this month? What did we do really well? And again, this is all about having your conversations with your reps, with your manager. It’s not just someone behind a computer. These are conversations where you work it together. You all agree what worked well, right? Then you also decide on what didn’t worked well. Like what was not performing. And it could be some of your messaging when you’re talking to your customers. It could be pricing strategies. It could be many factors. So define what didn’t work well. Then coming back to this top three. How can we start thinking about removing the resistant factors, right? What are the three of them? Why were they the top three, right? And then once you’ve agreed all of these messages, the next most important part of doing all of this is, what are you gonna do next? What is this information telling you? What do you need to act upon this information so next month is going to be better than this month, right? And this is the bit the glue that brings it all together. Like I’m not a big fan of it. There’s no point in measuring just for the sake of it. Measuring has to have value. These are all your key metrics. I don’t want every metric, every performance indicator, just the key that’s gonna help you categorically define what you as a business and a team need to do next. I hope this make sense. If you’ve got any questions, just get in touch. And in the meantime this is Shay Lynch saying thanks for watching.